The Game-Changer for Homelab Monitoring
One app frequently goes under the radar when building a truly powerful homelab dashboard: Grafana. This open-source platform isn’t just for the big leagues or seasoned system administrators. Whether you’re juggling virtual machines, managing your own backup NAS, or running a trio of cluster nodes at home, Grafana can become the central hub you never knew you needed.
Why Grafana? Unmatched Observability and Flexibility
Forget quick plug-and-play dashboards. Grafana is much more than a one-click solution—it’s the canvas for data visualizations, letting you bring together metrics, logs, and traces from platforms like Prometheus, InfluxDB, and Telegraf. It’s widely recognized by network administrators and SaaS engineers, but it’s equally potent for home-based enthusiasts managing Unraid servers or custom NAS builds. Rather than confining you to pre-made visuals, Grafana lets you sculpt the dashboard that mirrors your unique digital universe.
The Setup: Complex at First, Streamlined With the Right Guide
Deploying Grafana is as flexible as you want it to be, but the initial stack configuration can feel daunting. A practical starting point is the dockprom Docker stack, which bundles essential services like Grafana, Prometheus, cAdvisor, NodeExporter, and AlertManager into a harmonious microcosm. If you’re using Portainer to manage your containers, resist the urge to rush; you’ll need every setup file from the GitHub repo, not just a simple docker-compose copy-paste.
For those who value speed and stability, it’s best to clone the entire repo and launch with a single docker command. If, like many DIYers, you like to integrate everything natively—be ready to manually manage each piece and resolve dependencies. Patience here pays off: a fully integrated dashboard can be running in minutes (not hours) with the proper approach.
Expanding Beyond a Single Node: Multi-Server and NAS Integration
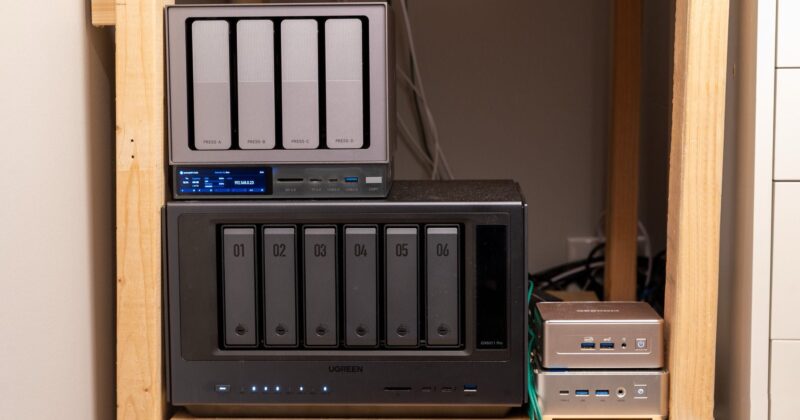
Where Grafana truly shines is in multi-node setups. Home labs with multiple Proxmox hypervisors, custom Unraid servers, and even commercial NAS hardware like Ugreen are all candidates for observability. Start by running node_exporter on each machine—a process as straightforward as downloading, extracting the binary, and configuring a systemd service. With monitoring endpoints active, simply edit your prometheus.yml file to add each node, grouping hosts by their function or hardware type.
Curated Dashboards and Custom Setup
If templated dashboards are enough for your needs, trying popular Grafana dashboards—such as dashboard ID 1860—is the fastest way to gain insights on system health, processor usage, or disk activity. Importing these through the Grafana UI can take minutes. For homelabbers needing granular control or mixed environments (Proxmox + Unraid and more), sharing customized dashboard JSONs is a community lifeline. Swapping out IP addresses, datasources, and hostnames is simple, especially compared to the initial data pipeline setup.
Why You Shouldn’t Delay
It’s easy to procrastinate a project that seems complex on the surface. But once Grafana is up and running, the ability to visualize metrics like memory consumption, storage usage, and processor load across all nodes, at a glance, is transformative. The sense of control and clarity you gain easily outweighs the initial investment in setup time. For broad setups, expect to spend a couple of hours tuning everything to your specific needs; for simpler “single node” scenarios, you could be charting data in under 20 minutes.
Practical Tips for a Smooth Grafana Onboarding
- Start with the official Grafana documentation and explore examples tailored for your environment.
- Leverage the dockprom stack to fast-track your initial deployment and reduce troubleshooting headaches.
- Test node_exporter locally on each node before adding them to Prometheus—seeing metric output means you’re set up correctly.
- Don’t hesitate to adjust the layout and appearance of your dashboard—Grafana is all about making observability intuitive for your workflow.
With the right combination of diligence, the best tools, and a little trial-and-error, Grafana can help anyone—from casual homelabbers to full-stack tinkerers—attain a level of oversight usually reserved for enterprise environments. The modern homelab truly comes to life when all its moving parts can be monitored from a single, beautiful dashboard.